EDITOR NOTE: Everyone knows that “inflation is insidious,” to quote a well-known adviser that we won’t name. Well, it appears that inflation, according to the Fed, is more or less under control--less than their 2% target rate, and well below the average rate of 3.76% since WWII. So, has your purchasing power bumped up as a result? No, it hasn’t. It seems to have gotten worse. Why is that, we ask. Inflation is not the only thing we have to worry about (and the chart below shows you why). And in this unprecedented post-COVID world, no economist is certain as to the outcome of the lockdown or the coming wave of infections. Something is about to break. And the thing we can rely on--rather, the only “certain” thing-- comes in the form of a safe haven hedge.
The Consumer Price Index for Urban Consumers (CPI-U) released yesterday morning puts the year-over-year inflation rate at 0.12%. It is below the 3.76% average since the end of the Second World War and below its 10-year moving average, now at 1.73%.
The Bureau of Labor Statistics (BLS) has compiled CPI data since 1913, and numbers are conveniently available from the FRED repository (here). Our long-term inflation charts reach back to 1872 by adding Warren and Pearson's price index for the earlier years. The spliced series is available at Yale Professor (and Nobel laureate) Robert Shiller's website. This look further back into the past dramatically illustrates the extreme oscillation between inflation and deflation during the first 70 years of our timeline.
For a long-term look at the impact of inflation on the purchasing power of the dollar, check out this log-scale snapshot of fourteen-plus decades and how the value of the dollar has declined.
Originally posted on Advisor Perspectives
While headlines focus on missiles and ceasefires, the real story unfolding is financial. A prolonged…
Gas just crossed $4 again, and the experts are already spinning it. They say it’s…
Gold just surged past $4,600 an ounce—and most headlines are missing the real story. While…
The latest labor data paints a deceptively calm picture—low unemployment, modest layoffs—but beneath the surface,…
Something is shifting in the silver market—and it’s not subtle if you know where to…
Americans feel it every day—low energy, rising illness, shrinking portions, and food that doesn’t even…
This website uses cookies.
Read More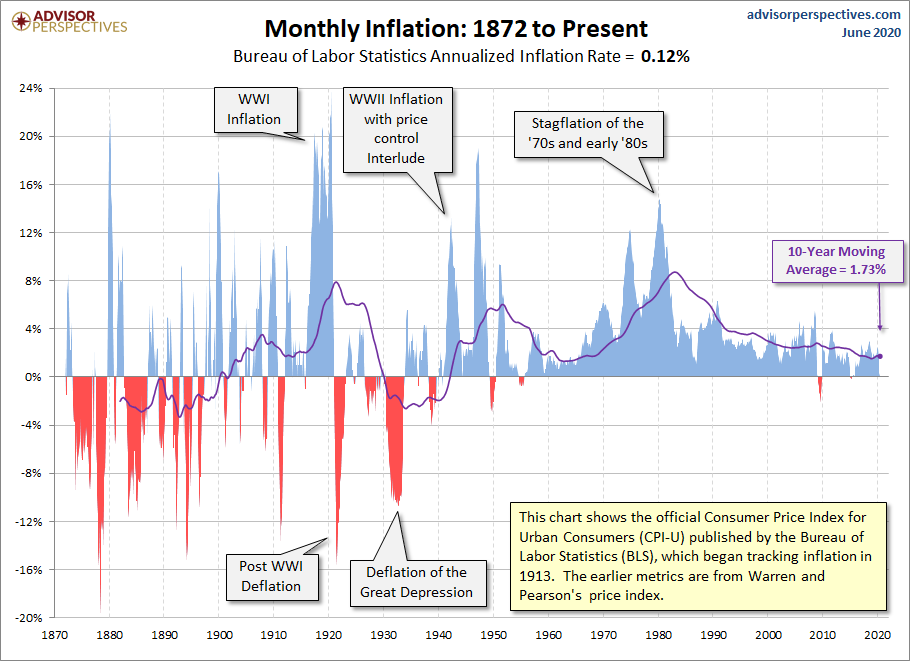