Gold Shines as Markets Falter: Traders Bet on Rate Cuts in 2024
Volatility extended for another day on Thursday, wiping the crypto gains recorded on Wednesday from the books and treating stock traders to whipsaws and afternoon downturns while gold shined bright.
“Yesterday’s sharp 4% rally to $58,500 proved short-lived as Bitcoin (BTC) quickly retraced to $56,400,” noted analysts at Secure Digital Markets. “Despite persistent selling pressure, the $56,000 level held firm as support.”
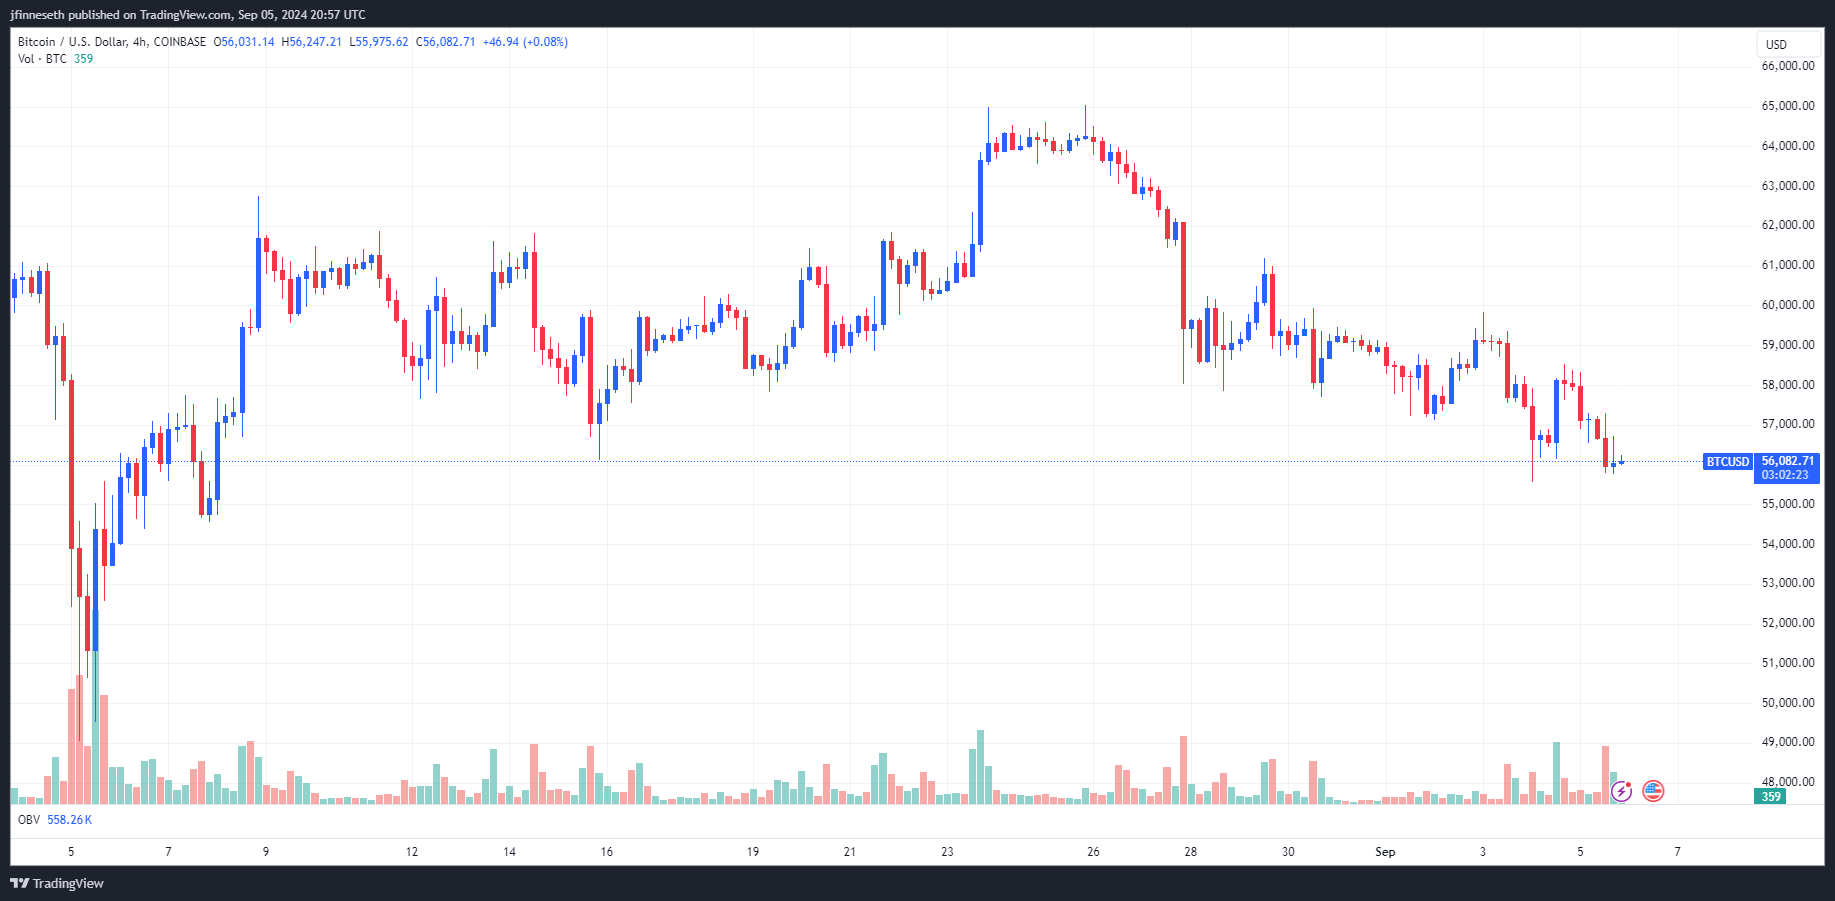
BTC/USD Chart by TradingView

“Realized volatility appears to be decreasing, and the spread between 30-day options at-the-money implied volatility is narrowing,” they added. “Historically, this suggests a significant price movement could occur within the next two to three weeks.”
At the time of writing, Bitcoin trades at $56,058, a decrease of 3.48% on the 24-hour chart.
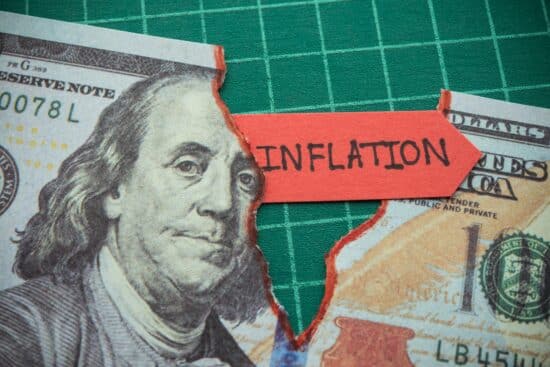
Following Wednesday’s normalization of the two- and 10-year Treasury yield curve, Thursday’s jobs report – with private employers in the US posting their smallest monthly hiring growth since January 2021 – further stoked fears that the Fed waited too long to cut interest rates and has pushed the economy to the brink of recession.
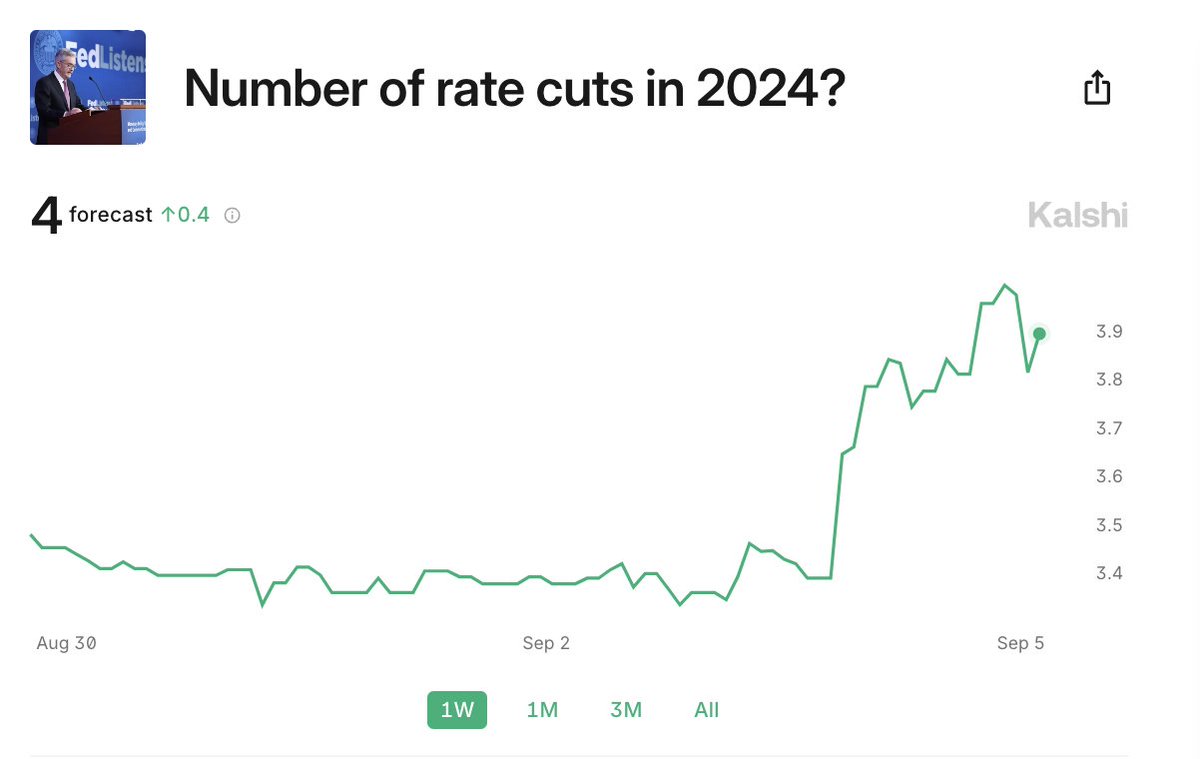
As a result, the Kalshi prediction market shows traders “are now pricing in 4 rate cuts in 2024, or 100 bps of cuts, for the first time since the August 5th crash,” analysts at The Kobeissi Letter reported.
“Over the last 2 days, prediction markets have priced in an additional rate cut in 2024,” they said. “This comes as labor market data has deteriorated around the board. It's clear that unemployment data is quickly becoming the primary driver of Fed policy, along with inflation. Tomorrow's jobs report is huge.”
“Tomorrow's jobs report will be the key factor in determining if a 50 bps rate cut is coming this month,” the analysts said. “If the jobs report is in-line with expectations, or better, we believe a 25 bps rate cut is coming. Interest rate expectations appear to be shifting too dovish again.”
According to John Fath, managing partner at BTG Pactual Asset Management US LLC, “The Fed may need to act sooner, possibly with a 50 basis-point cut. If they do, the yield curve should fully disinvert.”
Analysts at Secure Digital Markets noted that “Interest rate swaps indicate that traders have fully priced in a 25 basis-point cut at the upcoming Fed meeting, with a 30% chance of a more substantial half-point reduction. Overall, markets are expecting 110 basis points of rate cuts across the three remaining policy meetings this year.”
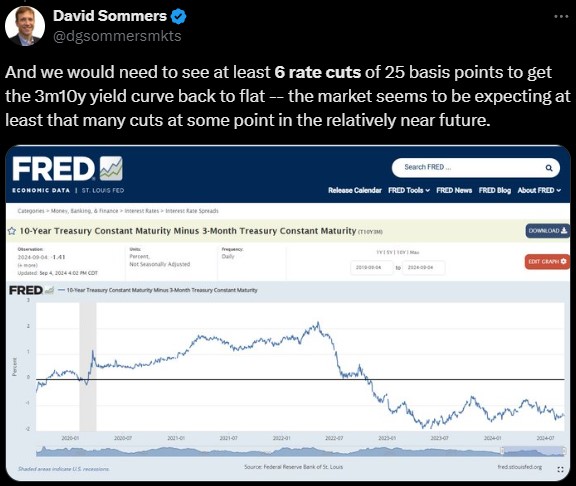
And X user David Sommers noted that while the 2m10y yield curve has turned positive, it would take at least six rate cuts to get the 3m10y yield curve back to neutral.
For now, all eyes are on Friday’s August jobs report, which will be one of the last bits of major economic news for the market and Fed to digest before the FOMC meeting on Sept. 18.
“This market is sort of showing restless qualities in the sense that it can't really figure out if good news is good news or bad news is bad news, and we continue to search for direction on all of this macro data,” Liz Young Thomas, head of investment strategy at SoFi, told Yahoo Finance. “I think if tomorrow's data comes in cool or soft compared to expectations, there will be a negative reaction in the market and likely further selling in a lot of those mega-cap names that have led us up to this point.”
At the close of markets, the S&P and Dow finished in the red, down 0.30% and 0.54%, respectively, while the Nasdaq gained 0.25%.
And while stocks and cryptos trended lower, gold returned to its winning ways, with spot gold up 0.84% at the time of writing and trading at $2,516.20 per ounce.
Bitcoin bulls could soon push higher
According to TradingView analyst TradingShot, Bitcoin has been under intense bearish pressure since early last week, but history suggests that it could soon restart its uptrend higher.
“Bitcoin may be under a quite strong short-term correction since the August 27 rejection on the 1D MA200 (orange trend-line), but based on this 2-year Cyclical Chart, it has high chances of finding Support again and starting a rally similar to the two it had over this time span,” TradingShot said in an update on Thursday.

“Let's start with the long-term outlook, which remained bullish after BTC hit and rebounded (August 06) on the 1W MA50 (red trend-line), its long-term Support since March 13, 2023,” he said. “The formation of the 1D Death Cross may have offset some of this optimism, but on this cyclical pattern, it is not a bearish sign as last time it emerged (September 11, 2023), Bitcoin formed its new bottom at the time.”
“In fact, it was inside a short-term (dotted) Channel Up, the vessel pattern, which took the price from the bottom to a new +100% rally,” he added. “The key parameter was the fact that the 1D MA200 broke and later was retested and held as Support. This is most likely why we are having the recent pull-back – because even though the price broke above the 1D MA200, it failed to hold.”
TradingShot noted that “The 1D RSI also prints a similar pattern to the previous two bottom fractals on this chart, and it appears that relative to those past sequences, we are currently after the first RSI peak and pull-back. On the price action, we illustrate the relative position of now and then with circles.”
“The Sine Waves [are] perhaps the most efficient depiction of the price cyclicality, clearly displaying where Bitcoin should be bought and where sold,” he concluded. “At the moment, we are just past the most optimal Buy Entry, so the opportunity still exists but may not last for long! Another +100% rise from August's recent bottom will see Bitcoin test the psychological benchmark of 100k.”
In the near term, MN Trading founder Michaël van de Poppe highlighted $56,000 and $58,200 as the support and resistance levels to watch for indications on whether the next move for Bitcoin will be a breakout higher or a breakdown lower.
Altcoins struggle amid Bitcoin’s weakness
Only a dozen tokens in the top 200 recorded gains on Thursday, with most seeing losses in excess of 2%.
ApeCoin (APE) led the field with a gain of 7.8%, followed by increases of 6.7% for Helium (HNT) and 5% for Toncoin (TON). Mog Coin (MOG) was the biggest loser, falling 11.1%, while Popcat (POPCAT) declined by 10.6%, and MANTRA (OM) lost 8.3%.
The overall cryptocurrency market cap now stands at $1.98 trillion, and Bitcoin’s dominance rate is 56.2%.
This article originally appeared on Kitco News.


The financial market is crumbling and EVERYONE will be affected. Only those who know what's going on and PREPARE will survive... dare we say thrive. Our 7 Simple Action Items to Protect Your Bank Account will give you the tools you need to make informed decisions to protect yourself and the ones you love.