Gold vs. Silver: Will The White Metal Outperform The Yellow One?
EDITOR NOTE: A lot has been written about the gold/silver ratio, especially when it reached (what some characterized as) a 5,000-year high. We wrote about it, and over the last few weeks, we all saw the ratio collapse. Some analysts, such as the one writing the article below, are saying that the ratio can decline even further--good news for the white metal. As much as we agree, we urge you to pay attention to the economic fundamentals behind this bullish drive, and not to rely solely on the ratio. The ratio is an indicator, but the fundamentals are what ultimately drive the market. If you have any questions, check out our other articles on silver to which the article below makes a good supplement.
The gold-to-silver price ratio has witnessed erosion in values, with the white metal showing some strength following improved demand on lower price and stock scarcity amid lockdowns globally.
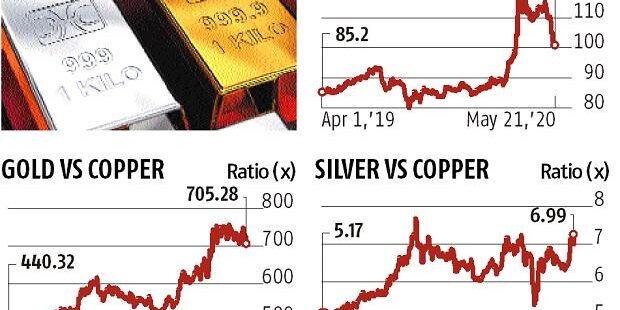
The ratio, which indicates how much silver can be bought for one ounce of gold, had tested 124 levels in March this year following weakening silver demand because of an industrial and economic slump. The ratio was at record 79.2 in September last year. About half the demand for silver comes from the industrial segment.
In the past few decades, hardly two times the ratio has touched or exceeded 100. Since Wednesday,
the ratio is hovering between 100 and 101.
Traders track the ratio to decide where to shift positions within the precious metal segment; many of them trade in the ratio. If they see ratio rising, they buy gold and sell silver in proportion.
Ajay Kedia, director, Kedia Advisory, said: “Even around 100, the ratio is far higher than its historical average of 60. To match that level, either gold must fall or silver must rise (or silver falls much lower than gold). Silver is expected to do well this year because of a combination of higher industrial and investment demand, and tightened supply owing to mine production issues and output cuts. Also, industrial demand is expected to improve with the resumption of economic activities as countries ease lockdown measures.
Technically, we see the gold-silver ratio breaking the 100-mark and testing support near to 94.”
If that level doesn’t sustain, further weakness in the ratio possible. This would mean silver outperforming gold, though the yellow metal is not appearing weak currently.
There are other indicators also that traders use to take a call. For example, the gold-to-copper price ratio, which is also known as the stress ratio. The higher the ratio, the bigger the stress in the economy. This happens when the gold price is high but copper is staying cheap.
Currently, the gold-to-copper price ratio — rising for the past two months — is 705.28. This was 756 last month and only 429 in April 2019. The ratio is expected to remain high, which means stress in the economy is likely to continue.
Since the global benchmark or barometer for economic activities, as well as industrial growth, is copper, the silver-to-copper price ratio is also an indication of firmness in silver. The ratio has already increased in the last one month and it is not at 6.99. In April 2019, it was at 5.
Silver has been quoting at a premium in India since mid-march because of huge scarcity.
Originally posted on Business Standard


