Has The Recovery Started Already?
What Real-Time Coronavirus Activity Trackers Are Showing
There was some good news in the latest coronavirus activity tracker from Goldman: signs of life amid an unprecedented collapse in aggregate demand.
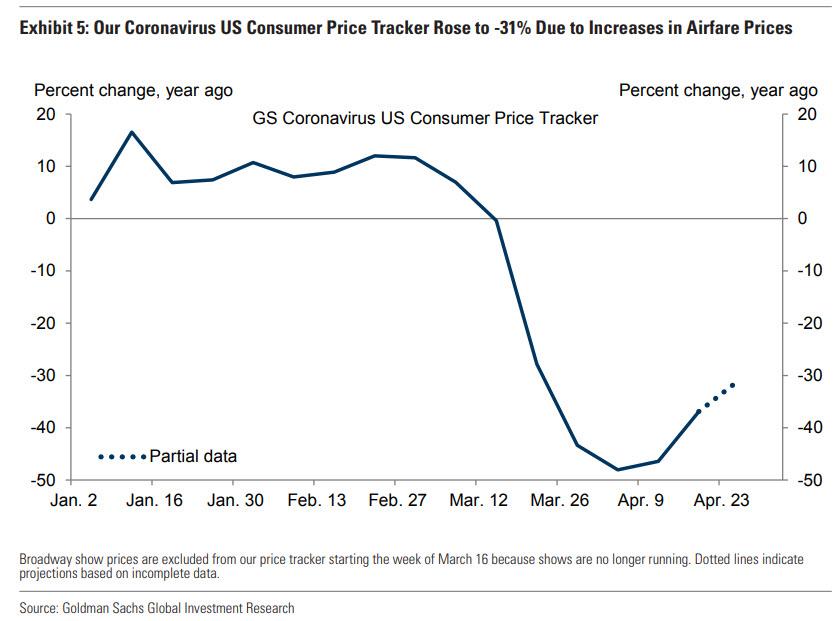
As the following chart tracking daily consumer prices shows, after cratering by as much as 50% into the middle of April, consumer prices have rebounded in the past week to -31%, which while still clearly ugly, indicates that some demand is coming back (in this case rising airfare prices).
That said, other real-time activity trackers are showing the opposite, namely a downward inflection point such as for example the recent decline in China Industrial Activity which has backtracked in the past two weeks, while the US Industrial Activity Tracker clearly hovered at post crisis lows of -19%. This suggests that after a forced rebound in the past month, China may be again relapsing to the global industrial malaise, even as the US has still to find the lows.
Read Original Article at zerohedge.com

